 ContractorKeith
 one agent run can leave tool calls in one terminal, token numbers in a log file, errors somewhere else, and me scrolling upward like the answer might be hiding above line 4,000.
we built Agent Observability TUI because that is a lousy way to debug anything.
what a TUI is
TUI means terminal user interface. it is an app with panels, tabs, lists, and keyboard controls, but it runs inside a terminal instead of a browser window.
this one collects supported agent trace data into a local SQLite database, turns it into one event timeline, and lets you replay or compare sessions without running the agent again.
the important word is supported. version 0.1.0 can import documented JSONL traces, watch a trace file while another program appends to it, or launch one child command and observe that process. it does not secretly attach itself to any agent already running on your computer.
why we built it
I use more than one agent and more than one framework. when a loop fails, I need to know what the model reported, which tool ran, where the error appeared, how long the work took, and whether the saved evidence is safe enough to inspect.
the information existed. it just did not live together.
and comparing two runs was mostly memory and terminal archaeology. did the cheaper model actually use fewer tokens? did one session call the same tool four times? was that cost copied from a provider, calculated from a local price file, or guessed?
I did not want the dashboard to invent an answer when the trace did not contain one. unknown tokens stay unknown. an unrecognized model stays unpriced. missing process measurements stay missing.
that restraint took more code than printing a zero.
what the screen shows
the main trace view has a session list, an event timeline, a selected-event panel, and a summary across the top. other tabs compare stored runs and show the state of the saved evidence chain.
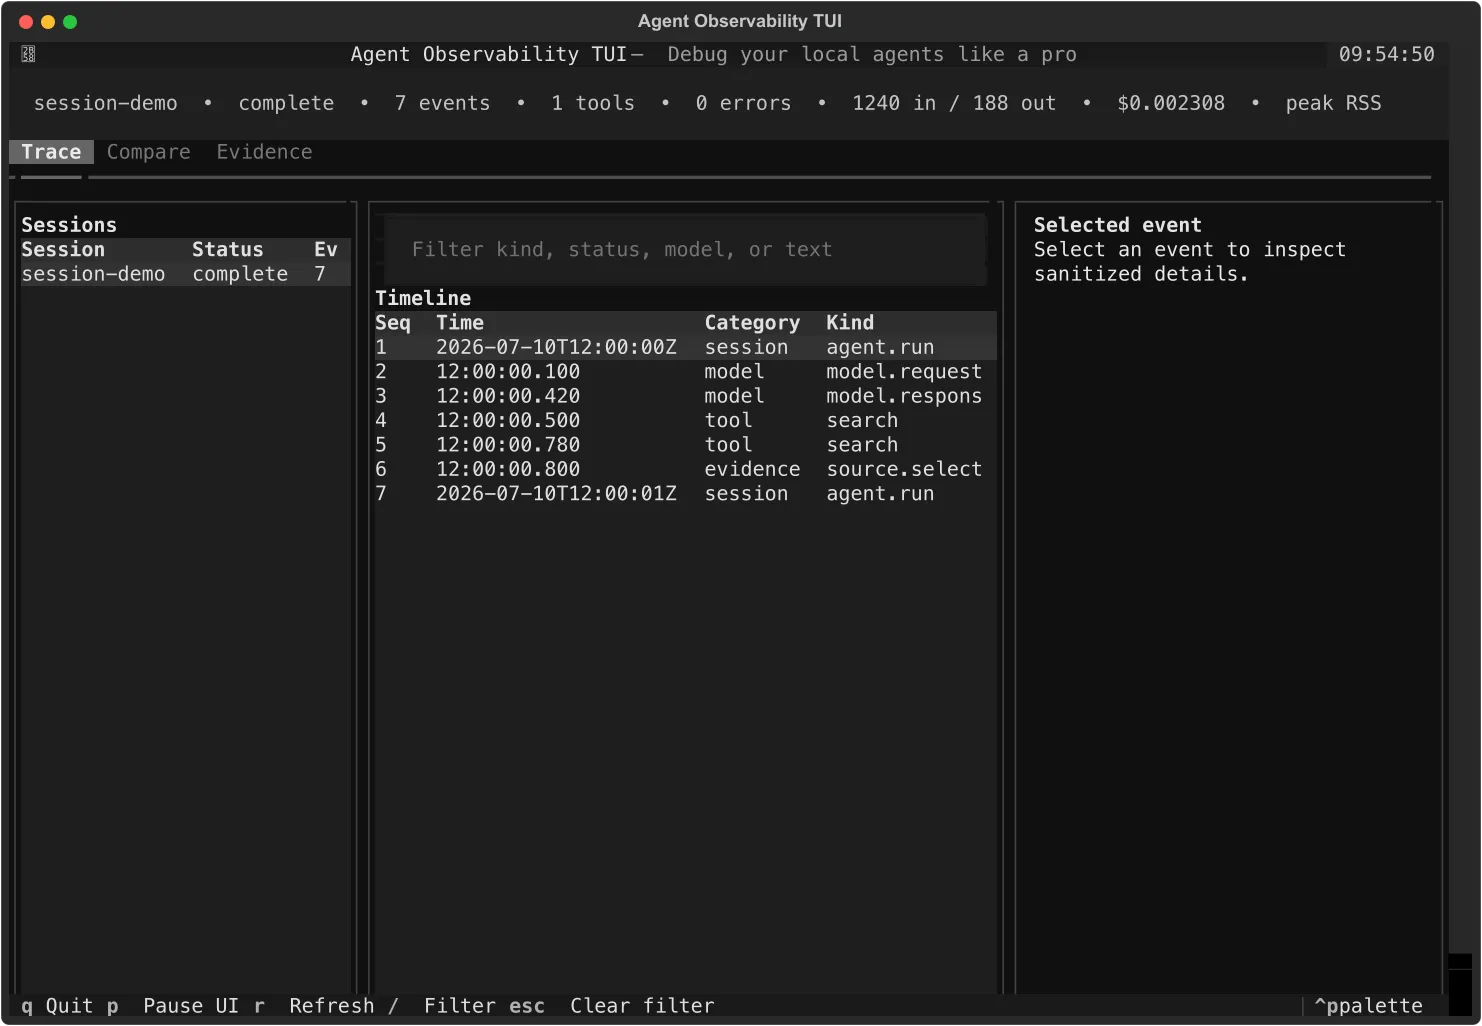
the screenshot came from the built-in synthetic demo. its $0.002308 cost uses a clearly labeled fictional demo rate, not a live provider bill. the run has seven events, one tool call, no errors, and source-reported token counts.
that is enough data to learn the interface without feeding the project a real prompt, credential, customer file, or private tool result.
how to run the demo
you need Git, Python 3.11 or newer, and uv. the project is installed from source right now and is not on PyPI.
open a terminal and run:
git clone https://github.com/ContractorKeith/agent-observability-tui.git
cd agent-observability-tui
uv sync --locked --all-groups
uv run agent-observe demo
git clone copies the source. uv sync creates an isolated Python environment and installs the locked dependencies. the last command loads safe sample data and opens the dashboard.
if you only want to check that it works without opening the interface:
uv run agent-observe demo --headlesspress Q to quit, R to refresh, / to filter the timeline, and Escape to clear the filter.
four ways I expect to use it
first, import a finished trace and see the full order of events:
uv run agent-observe import ./trace.jsonl --adapter auto --json
uv run agent-observe replay SESSION_ID
second, watch a JSONL file while a local agent writes complete lines to it:
uv run agent-observe watch ./live-trace.jsonl --adapter nativethird, start one child command through the observer:
uv run agent-observe run --cwd ./my-agent -- python agent.py --task demoeverything after -- is passed to the child program as a direct argument list, not through a shell. the child can still use the network or change files, so this mode observes a process. it does not contain one.
fourth, compare two stored sessions without paying to rerun either model:
uv run agent-observe compare SESSION_A SESSION_B --jsonthat comparison can show duration, status, tool and error counts, tokens, local cost estimates, and available process measurements. it does not grade which answer was better.
replay and evidence without pretending too much
replay is read-only. it reads the stored session and does not invoke an agent, model, tool, or child process.
the project also stores a SHA-256 chain over sanitized event records. verify can detect an accidental edit, deletion, insertion, or reorder in that local record chain.
but it is not notarization. somebody who can rewrite the local database can also recompute the chain, and the chain covers sanitized records rather than proving every byte of the original trace.
you can export a session as JSON or Markdown:
uv run agent-observe export SESSION_ID ./evidence.json --format json
uv run agent-observe verify-export ./evidence.json --json
review the export before sharing it anyway. automated redaction lowers risk; it cannot promise that every private detail in every unknown trace format was found.
who this is for
if you are building an MCP server, the timeline can help you find repeated calls or malformed captured messages. if you run two local models, comparison can show the measured differences without sending either trace to a hosted dashboard. if an agent loop fails overnight, replay gives you a stable record to inspect in the morning.
and if you are new to agent development, the synthetic demo shows what a request, response, tool call, evidence event, and completed session look like in order.
still early. already useful.
contribute without publishing your secrets
the code is MIT-licensed on GitHub. bugs, small documentation fixes, adapter tests, terminal accessibility work, and carefully scoped source support are welcome.
read the contribution guide before attaching a trace. use synthetic names, paths, prompts, tool arguments, and outputs. never post a real API key, cookie, customer record, private prompt, home-directory listing, or raw agent session.
the issue tracker is the best place for reproducible bugs and focused ideas. the roadmap explains what is being considered next.
if an adapter reads your trace incorrectly, tell us the source and version, reduce the failure to a small synthetic example, and include the exact command. that is enough for somebody else to reproduce the problem without putting your work on the internet.